Author: Zhang Qiyu
Background:
Polaritons are collective oscillation modes formed by the strong interaction between light and particles or quasiparticles in matter. Scattering-type scanning near-field optical microscopy (s-SNOM) can directly perform real-space imaging of polaritons — an advantage that enables researchers to carry out quantitative near-field characterization, helping people study various types of polaritons and their interactions more comprehensively and deeply. However, most current research focuses on the near-field quantitative characterization of polaritons in the mid-infrared band, with relatively little work in the visible-to-near-infrared range.
Recently, Laura N. Casses and colleagues performed quantitative characterization of exciton-plasmon polaritons (EPPs) in WSe2/Au at room temperature based on a reflection-configuration s-SNOM. The near-field results measured by s-SNOM directly yield a Rabi splitting energy of 81 meV and a polariton loss of 55 meV, confirming that the system is in the strong coupling regime. These results are highly consistent with theoretical predictions and far-field results. This work was published in the journal ACS Photonics (https://doi.org/10.1021/acsphotonics.4c00580).
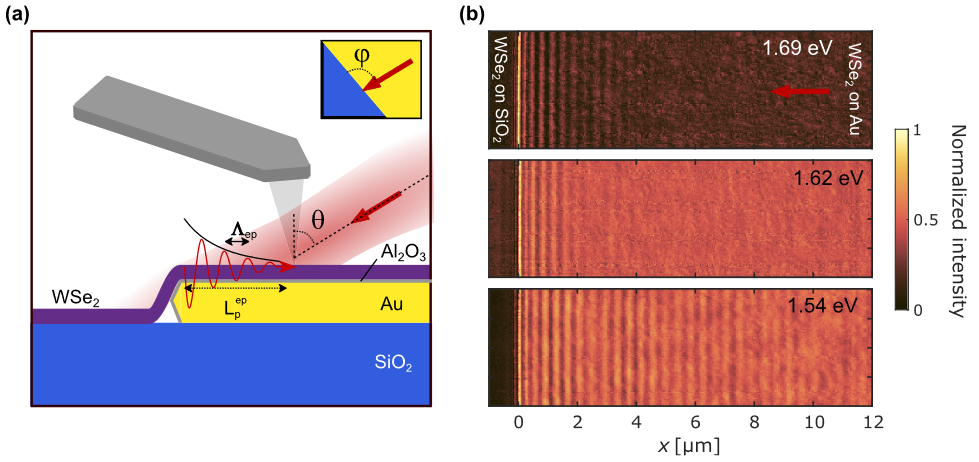
Fig. 1 Near-field measurement of exciton-plasmon polaritons (EPPs) propagating on WSe2 on a monocrystalline gold platelet.
(a) Experimental schematic, where Λep is the wavelength of the edge-launched polariton, Lepp is the propagation length of the edge-launched polariton, and θ is the incident polarization angle. The inset in the upper right shows a top view of the sample, where φ is the angle between the incident light and the sample edge;
(b) Near-field intensity at three different excitation energies; the origin of the x-axis is at the edge of the gold platelet, and the arrows indicate the direction of the incident light.
Main text:
The structure of this work is shown in Fig. 1a: 13 nm of WSe2 is placed on a 100 nm monocrystalline gold disk covering one boundary, with a 2 nm Al2O3 layer between the WSe2 and the Au, and the excitation wavelength corresponds to 1.5–1.7 eV.
In the near-field configuration, there are three main ways to excite polaritons: tip-launched, edge-launched, and tip-reflection edge-launched. The multiple possible excitation paths lead to complex interference patterns, complicating measurement analysis. Therefore, in this work, the incident light was controlled to be perpendicular to the Au disk edge to maximize the proportion of edge-launched excitation and reduce the difficulty of subsequent analysis. It is worth mentioning that the work deliberately weakly focused the light spot (diameter ~50 μm) so that the edge was always covered by the incident light during scanning. The interference fringes in the near-field image of Fig. 1b reveal the propagation characteristics of the EPPs; at different excitation energies, the EPPs exhibit different periods and propagation distances.
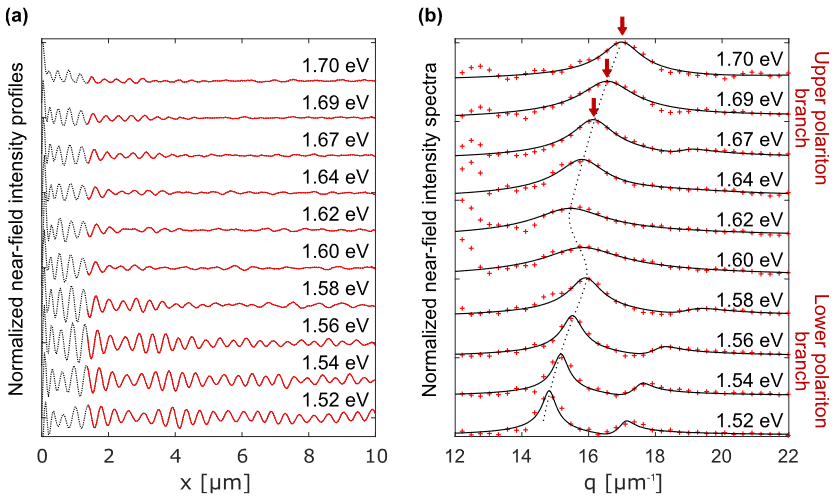
Fig. 2 (a) Fringe profiles of the WSe2/Al2O3/Au structure measured by s-SNOM at different excitation energies; the red portions of these profiles are used for Fourier transformation;
(b) Fourier transforms of the fringe profiles (red crosses) and their fits (black curves); the peaks marked by red arrows indicate the positions of the edge-launched polariton wavevector Kep.
By extracting real-space line profiles perpendicular to the edge (Fig. 2a) and performing FFT (Fig. 2b), the wavevector value Kel and propagation length Lpep of the edge-launched EPPs can be directly obtained. When the tip is close to the edge, multiple excitation mechanisms coexist and interfere with the analysis, so line profiles within 1.4 μm of the edge were truncated before the FFT. The A exciton energy of WSe2 is around 1.63 eV. The black dashed line formed by the Kep peaks in Fig. 2b shows a pronounced "back-bending" phenomenon near 1.6 eV, which is a signature feature of exciton polaritons.
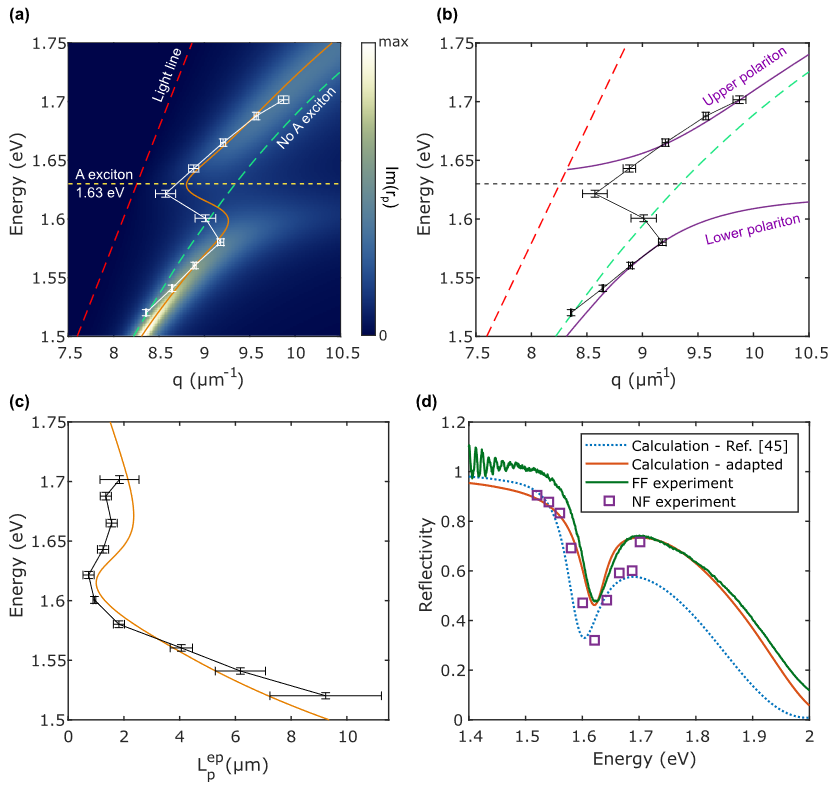
Fig. 3 (a) EPP dispersion of 13 nm WSe2/Au. The color map shows the imaginary part of the reflection coefficient calculated by TMM, and the white line with error bars corresponds to the experimental wavevectors extracted from the data. The orange line indicates the theoretical dispersion relation calculated by TMM. The dashed line represents the light line in air, the horizontal dashed line indicates the A exciton energy of WSe2, and the blue line represents the dispersion of a sample without the A exciton;
(b) Comparison with the dispersion relation of the coupled oscillator model (COM); the two polariton branches are shown in purple and the experimental wavevectors in black.
(c) Experimental (black curve) and theoretical (orange curve) polariton propagation lengths. Horizontal error bars correspond to fitting uncertainties;
(d) Comparison of the reflectivity of 13 nm WSe2/Au. Calculated using the WSe2 dielectric function of Munkhbat et al. (blue dashed line), measured directly with conventional far-field microscopy (green line), calculated using the dielectric function fitted to the far-field reflectivity (red line), and extracted from near-field measurements (purple squares).
The white line in Fig. 3a is the experimentally extracted dispersion curve; the horizontal error bars represent the FFT peak linewidth, and the vertical error bars represent the linewidth of the laser energy. To compare the experimental results with theory, this work adopted the transfer matrix method (TMM) applicable to anisotropic materials, calculating the dispersion curve by two methods. The first method is based on the reflection coefficient rp of this complex structure; the solution at its poles is a complex wavevector, and the real parts of the complex wavevectors at different energies constitute the dispersion curve (orange line in Fig. 3a). The other approach plots the dispersion map directly from the imaginary part of rp (background color map in Fig. 3a), a method usually associated with the optical density of states (DOS). Both theoretical calculation methods give consistent results that agree with the experimental results.
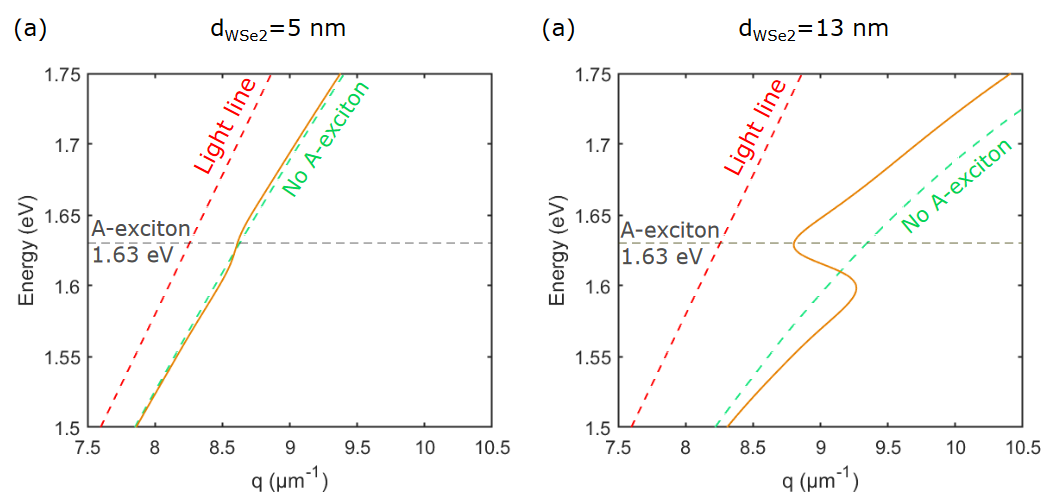
Fig. 4 Exciton-plasmon polariton dispersion relations calculated by TMM for (a) 5 nm thick WSe2 and (b) 13 nm thick WSe2. The orange lines correspond to the theoretical dispersion relations calculated by TMM. The red dashed line represents the light line in air, the horizontal dashed line indicates the A exciton energy in WSe2, and the green dashed line represents the sample dispersion without the A exciton.
The Rabi splitting energy is a key indicator of coupling strength. To predict ERabi, one must first consider the difference between the upper and lower branches at zero detuning. The zero-detuning state is the intersection of the exciton mode of WSe2 and the surface plasmon mode of Au when the A exciton is not coupled, as shown by the yellow (exciton mode) and blue (plasmon mode) dashed lines in Fig. 3a. The DOS method calculates ERabi = 89 meV at zero detuning (q = 9.4 μm⁻¹), but the results calculated by this method can often only be compared qualitatively with experimental results. Moreover, in this work, there is a significant drift between the theoretical and experimental back-bending centers, indicating the limitation of directly removing the A exciton from the dielectric function. In addition, the work also studied the dramatic influence of sample thickness on this method (Fig. 4). Therefore, it is very difficult to obtain the actual Rabi splitting energy directly through theoretical calculation, making quantitative experimental measurement of ERabi all the more meaningful.
At the back-bending center (q = 9.0 μm⁻¹), the theoretically calculated ERabi = 77 meV, while the ERabi = 81 meV obtained after fitting and optimizing the experimental data points — an error within 10% — confirming that s-SNOM has the ability to quantitatively measure ERabi with reliable results. In addition, fitting the Lpep in Fig. 3c yields a polariton loss of the EPPs of Γ = 55 meV. Finally, the complex wavevector can be determined according to Equation (1).
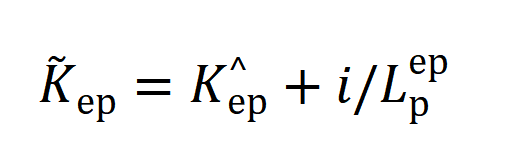
(1)
Summary:
Based on a reflection-configuration s-SNOM system, this work measured the EPPs of a WSe2/Au multilayer structure near the A exciton energy. Using only experimental data, the authors obtained a splitting energy ERabi = 81 meV and a polariton loss Γ = 55 meV, and thereby determined the complex wavevector. Both theoretical calculations and far-field experiments confirm the reliability of the results. The method of this work is predicted to be applicable to the quantitative characterization of complex-valued waves of different polarization types in reflection-configuration s-SNOM, which is of great significance for designing new polaritonic devices, understanding material properties in the strong coupling regime, and designing new metasurfaces.
References:
[1] Casses L N, Zhou B, Lin Q, et al. Full Quantitative Near-Field Characterization of Strongly Coupled Exciton–Plasmon Polaritons in Thin-Layered WSe2 on a Monocrystalline Gold Platelet[J]. ACS Photonics, 2024.