Author: Yin Tinggui
Recently, a research team at the Donostia International Physics Center (DIPC) in Spain published a paper in Advanced Optical Materials proposing a quantitative analytical spheroid model for scattering-type scanning near-field optical microscopy (s-SNOM). Based on an exact analytical solution in the quasi-electrostatic limit, the model achieves near-field spectral analysis that combines the accuracy of numerical simulation with the efficiency of analytical computation, without introducing phenomenological fitting parameters.
Research background
Scattering-type scanning near-field optical microscopy (s-SNOM) detects optical signals scattered from an atomic force microscope tip, enabling nanoscale optical imaging and spectral analysis. To accurately retrieve the complex permittivity of a sample from experimentally measured near-field signals (amplitude and phase), establishing a precise theoretical model of the tip-sample interaction is essential.
Current modeling approaches mainly face a trade-off between computational efficiency and physical rigor:
• Numerical simulations (e.g., FEM): can accurately handle complex tip geometries and field distributions, but the computational cost is enormous (a single spectrum can take days to compute), making them difficult to apply to high-throughput data fitting.
• Traditional analytical models (e.g., the finite dipole model, FDM): although computationally fast, they usually rely on phenomenological parameters (such as the g factor) to correct the tip polarizability. These parameters lack first-principles derivation, limiting the predictive power and quantitative accuracy of the model in analyzing strongly resonant materials.
To address these problems, this study proposes a rigorous analytical model based on a prolate spheroid geometric approximation.
Core model: exact solution in the quasi-electrostatic limit
By solving Laplace's equation in prolate spheroidal coordinates, the study derives an exact analytical solution for the surface charge distribution of a spheroid located above a sample of arbitrary permittivity in a uniform external electric field.
(a) Schematic of an s-SNOM tip operating above a homogeneous bulk sample. The inset shows a scanning electron microscope (SEM) image of a typical commercial s-SNOM tip.
(b) Geometry of the theoretical model: the tip is modeled as a prolate spheroid placed in a uniform external electric field. Due to the near-field interaction with the sample, a non-uniform induced charge distribution arises on the spheroid surface (the color gradient represents charge density, with red for positive and blue for negative charges).
Unlike the traditional image-charge method (which uses only a finite number of image charges), this model directly obtains the continuous polarization charge distribution on the spheroid surface by solving a truncated infinite system of linear equations. This approach avoids introducing empirical geometric fitting parameters and ensures that the model parameters (tip radius of curvature R, length L, tip-sample distance H₀) have clear physical meanings.
Model validation: evaluating accuracy and efficiency
To evaluate the reliability of the analytical model, the authors compared its computational results with full-wave finite element (FEM) numerical simulations. In the validation, the study defined a hypothetical material with a complex dielectric response (containing a Drude term, a strong Lorentz term, and a weak Lorentz term).
(a) The defined hypothetical sample dielectric function model, containing a Drude term (free carriers), a strong Lorentz resonance term, and a weak Lorentz resonance term.
(b) Normalized amplitude and phase spectra of the tip polarizability at the second (upper two panels) and fourth (lower two panels) harmonics.
Blue lines: results computed with the analytical spheroid model proposed in this work;
Blue dots: FEM numerical simulation results;
Red dashed lines: fitting results of the traditional finite dipole model (FDM).
The results show that the analytical spheroid model agrees highly with the FEM simulation results and, in this example, outperforms the FDM model in describing the strong resonance peaks.
The comparison demonstrates:
1. Accuracy: the analytical model precisely reproduces the near-field amplitude and phase spectra of the FEM simulations, with negligible deviations within numerical precision.
2. Efficiency: compared with FEM simulations, the computational speed of this analytical model is improved by about 3 orders of magnitude (from days to minutes), giving it the potential for real-time spectral analysis and large-scale data inversion.
Experimental application: fitting weakly and strongly resonant materials
The research team further used the model to fit and analyze the experimental spectra of two representative materials:
1. Polymethyl methacrylate (PMMA): representing a polymer material with weak molecular vibrational resonances in the mid-infrared band.
2. Quartz: representing a polar crystalline material with strong phonon-polariton resonances.
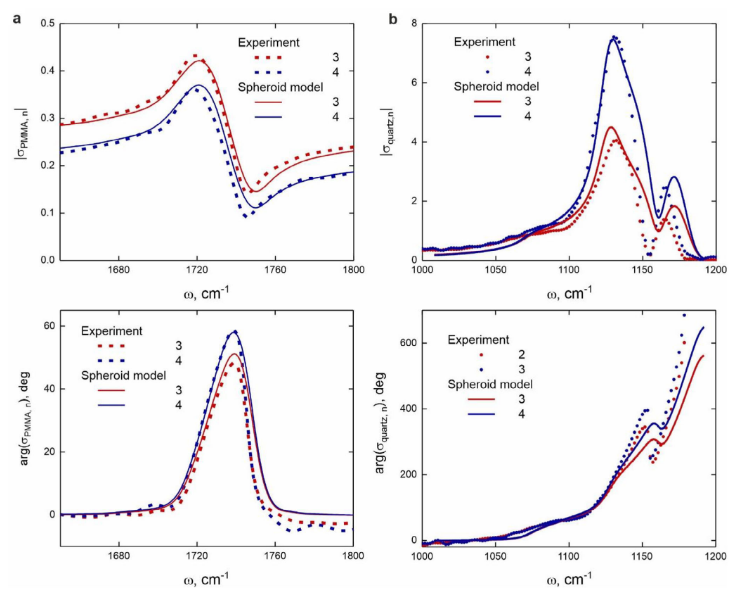
(a) Normalized near-field amplitude spectra of PMMA (3rd and 4th harmonics). Solid lines are model-calculated values; points with error bars are experimental data.
(b) Normalized near-field amplitude (left) and phase (right) spectra of quartz.
The fitting results show that the model can accurately describe near-field spectral features from the weak-coupling to the strong-coupling regime without adjusting phenomenological parameters.
Sensitivity analysis of key parameters
Based on the model's efficient computational capability, the authors performed a sensitivity analysis of key s-SNOM parameters. The study points out:
• The tip radius of curvature (R) and the minimum tip-sample distance (H₀) are the most sensitive parameters affecting spectral peak positions and intensities.
• The spheroid length (L), as an effective geometric parameter in the model, has some influence on the results, but its weight is lower than that of the tip-end parameters under the quasi-electrostatic approximation.
• It is noted that in practical experiments, H₀ is often difficult to determine precisely due to surface contamination layers and water films, and still needs to be treated as a fitting variable.
Conclusion
This work establishes a quantitative s-SNOM theoretical framework based on the spheroid approximation. Through rigorous mathematical derivation, it remedies the lack of physical rigor of fast analytical models while overcoming the computational cost limitations of numerical simulations. The model is not only suitable for inverting the optical constants of bulk materials; its open-source nature also provides an important data generation tool for machine-learning-based near-field spectral analysis.
Paper information
Title: Quantitative Analytical Spheroid Model for Scattering-Type Scanning Near-Field Optical Spectroscopy
Authors: Kirill V. Voronin, Iker Herrero León, Rainer Hillenbrand, Alexey Y. Nikitin
Journal: Advanced Optical Materials
DOI: 10.1002/adom.202501539
Open-source code: GitHub: Voronin-Kirill/s-SNOM_spectra
Note: All data and images in this article are cited from the above reference.