In previous articles we mentioned that scattering-type scanning near-field optical microscopy (s-SNOM) is a precision imaging instrument that spans the working ranges of both optical microscopes and electron microscopes, with unique advantages: ultra-high resolution, non-destructive detection, real-time imaging, and the ability to obtain optical information from sample surfaces.[1] s-SNOM generally consists of an electrical/optical signal source, a detector, an AFM, and peripheral optics.
The principle of terahertz s-SNOM is shown in Fig. 1. Terahertz waves are focused onto the AFM probe, which operates in tapping mode vibrating at frequency Ω. The periodic vibration of the probe modulates the terahertz waves. After receiving the modulated terahertz waves, higher-harmonic demodulation is performed, which can effectively remove background signals and noise to obtain the near-field signal. By scanning point by point with the AFM probe, the near-field signal at each point of the sample is obtained, achieving near-field nano-imaging. The imaging resolution of s-SNOM depends only on the tip size of the probe, independent of the wavelength of the incident wave, enabling s-SNOM to break through the diffraction limit of traditional optical imaging and achieve nanoscale resolution comparable to AFM.[2]
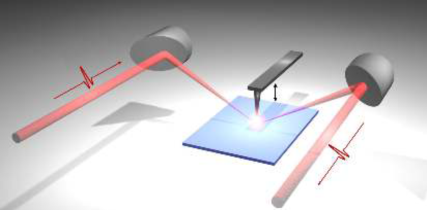
Fig. 1: Principle of terahertz s-SNOM
s-SNOM can also be classified according to its working mode, mainly into two types: continuous-wave s-SNOM and time-domain spectroscopy (TDS) s-SNOM, as shown in Fig. 2 and Fig. 3 respectively.
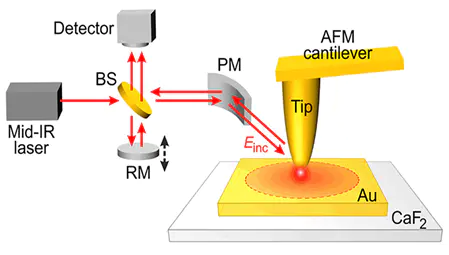
Fig. 2: Continuous-wave s-SNOM experimental setup[3]
- Continuous-wave s-SNOM
Basic principle
Light source: continuous-wave laser.
Working principle:
A very fine probe is placed above the sample surface, with the probe-sample distance much smaller than the wavelength of light. When the laser illuminates the probe and the sample, the probe and the sample interact, generating a locally enhanced electromagnetic field in the near-field region. The probe scatters this near-field light, and by detecting the intensity, phase, and other information of the scattered light, the surface topography and optical properties of the sample (such as refractive index and absorptivity) can be studied.
Characteristics:
No time resolution: only the static properties of samples can be studied; dynamic processes cannot be captured.
High spatial resolution: can reach the nanoscale, far exceeding the diffraction limit of traditional optical microscopes.
Application scenarios:
Studying the surface topography and nanostructures of samples.
Measuring optical properties of materials such as refractive index and absorptivity.
Observing static optical phenomena, such as surface plasmon polariton (SPP) distributions.
Advantages:
The system is relatively simple, with fast data acquisition, making it suitable for real-time imaging and static studies.

Fig. 3: Time-domain spectroscopy (TDS) s-SNOM experimental setup[4]
- Time-domain spectroscopy (TDS) s-SNOM
Basic principle
Light source: ultrashort pulse laser.
Working principle:
The principle is similar to that of continuous-wave SNOM. A very fine probe is placed above the sample surface, with the probe-sample distance much smaller than the wavelength of light. When ultrashort pulse light illuminates the sample, it interacts with the sample (through absorption, scattering, reflection, etc.). By detecting the time-domain response of the pulse light after interacting with the sample, the dynamic optical properties of the sample can be studied. For example, the propagation time and attenuation characteristics of light pulses in the sample can be measured, as well as the ultrafast response of the sample to light (such as electron relaxation and molecular vibration).
Characteristics:
High time resolution: ultrafast dynamic processes at the femtosecond or picosecond level can be captured.
Suitable for studying dynamic phenomena: such as carrier relaxation, molecular vibration, and chemical reactions.
Application scenarios:
Studying ultrafast dynamic processes, such as carrier dynamics in semiconductors.
Measuring ultrafast optical responses of materials, such as nonlinear optical effects.
Studying ultrafast phenomena such as molecular vibration and energy transfer.
Advantages:
Provides extremely high time resolution, suitable for studying ultrafast processes, and can reveal the dynamic optical properties of samples.
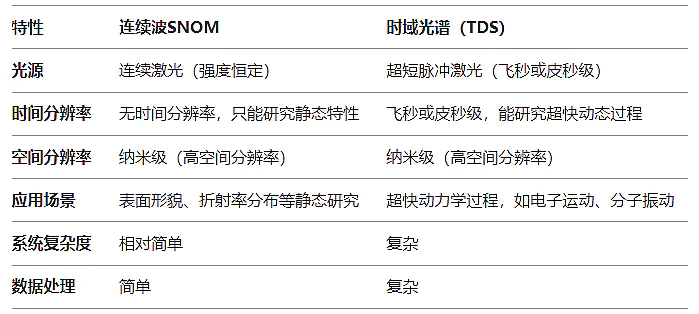
- Differences between continuous-wave SNOM and TDS
In 2013, Andreas P. Engelhardt et al. used continuous-wave s-SNOM to systematically study the influence of the tapping amplitude of scattering-type scanning near-field optical microscopy (s-SNOM) on the visibility of buried structures in terms of image contrast, signal strength, and noise[5]. The experimental light source frequency was about 28.3 THz, and the sample was a 25 nm gold triangle covered with a 32 nm PMMA coating, as shown in the figure below.
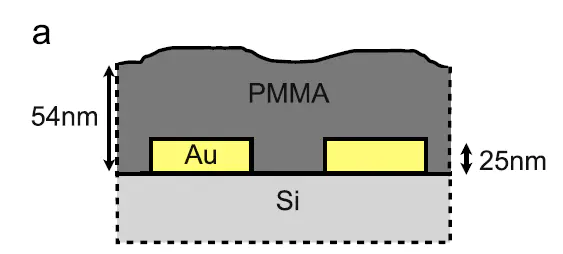
Fig. 4: Sample of a 25 nm gold triangle covered with a 32 nm PMMA coating
Fig. 5 shows images of topography and the optical amplitudes of the second- and third-order signals at different tip amplitudes. The experiment found that as the amplitude gradually increases, the topography image barely changes, but for the near-field signal, the outline of the triangle in the near-field scan becomes increasingly clear.
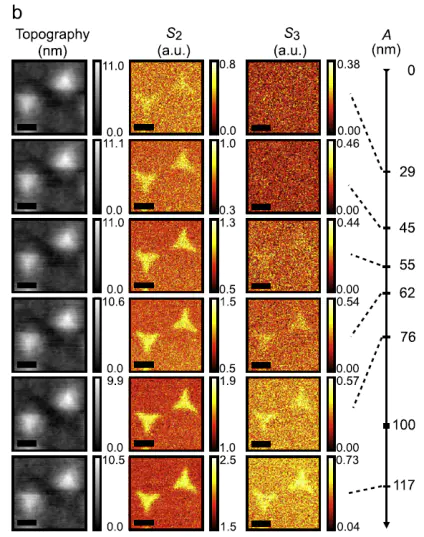
Fig. 5: Images of topography and second- and third-order optical amplitudes at different tip amplitudes
Fig. 6 shows the optical signal contrast and signal-to-noise ratio of the second- and third-order signals. The data show that as the tip amplitude increases, the optical contrast of the second- and third-order signals generally exhibits a downward trend, while the signal-to-noise ratio of the second- and third-order optical signals gradually increases.
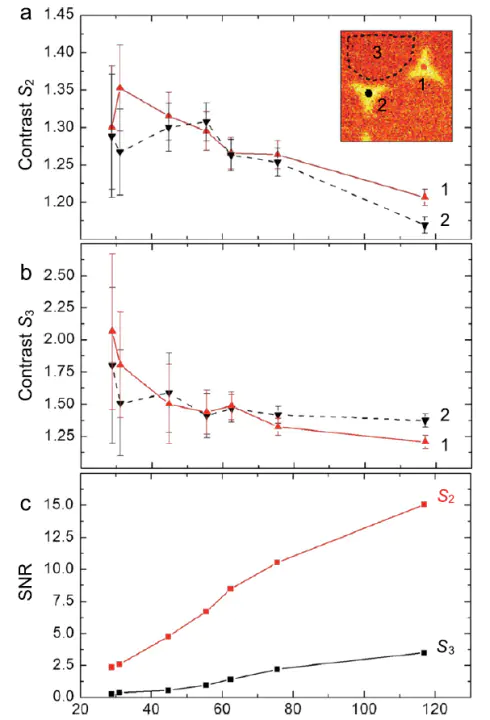
Fig. 6: Optical signal contrast and signal-to-noise ratio of the second- and third-order signals
The article points out that for quantitative analysis of SNOM measurements, the probe vibration amplitude and the signal demodulation order must be appropriately selected. For quantitative measurements, it is best to keep the vibration amplitude at a low level, but high enough to have a significant signal difference compared with the noise level of the experiment. In addition to amplitude, the choice of signal demodulation order is also a key factor for signal strength and background contribution.
In 2024, Pingchuan Ma et al. used time-domain spectroscopy (TDS) s-SNOM to study the spatial resolution characteristics of terahertz apertureless near-field imaging of metal lines buried deep beneath a silicon dioxide layer, with COMSOL simulation verification[4]. The experimental principle is shown in Fig. 3, and the experimental sample was part of the circuitry of a silicon-based chip, as shown in Fig. 7, where a) is the SEM image, b) is the AFM topography, and c) is the COMSOL model.
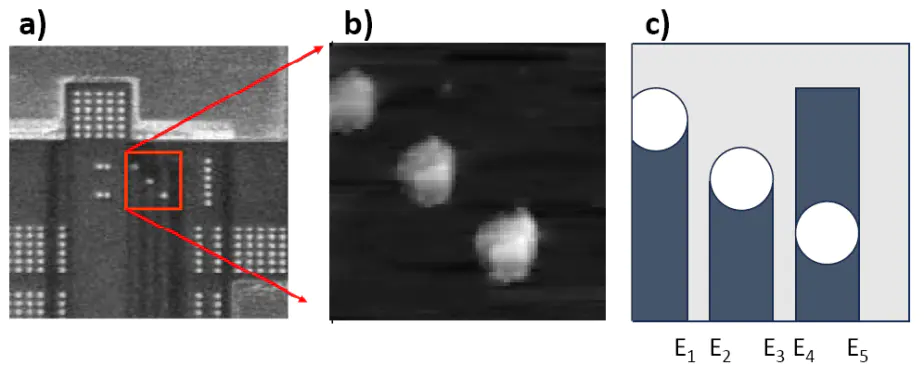
Fig. 7: SEM image, AFM topography, and COMSOL model of the experimental sample
The article presents THz s-SNOM imaging of nanoscale metal features buried beneath a dielectric layer, as shown in Fig. 8, at a depth greater than 5 times the AFM tip radius. Fig. 9 shows the measured (red) and simulated (black) spatial resolution at different harmonic demodulation orders for a 200 nm covering layer thickness. In both cases, the resolution is better at lower demodulation orders, contrary to what is usually observed for surface structures. The overall trend of the simulation is also similar to the experiment.
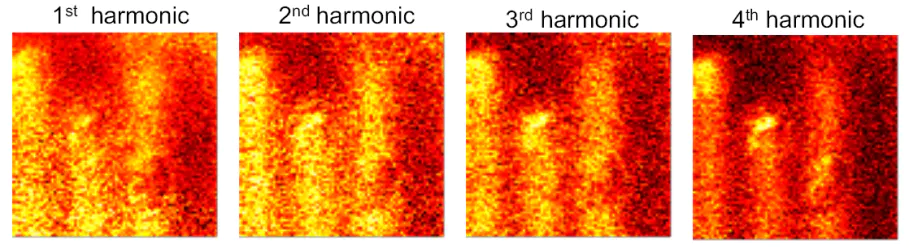
Fig. 8: 1st- to 4th-order THz s-SNOM images of the sample
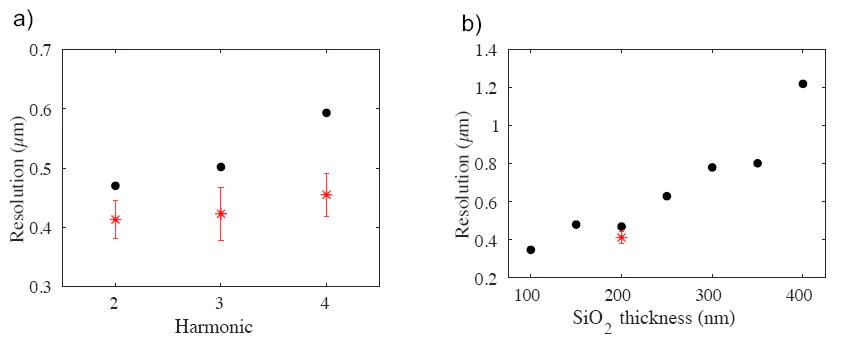
Fig. 9: Measured and simulated spatial resolution at different harmonic demodulation orders
The authors also observed a dependence of the contrast on the illumination direction of the incident light, caused by shadowing of the scattered signal by the AFM tip. These effects are all consistent with COMSOL simulations including the sample and the tip, as shown in Fig. 10.
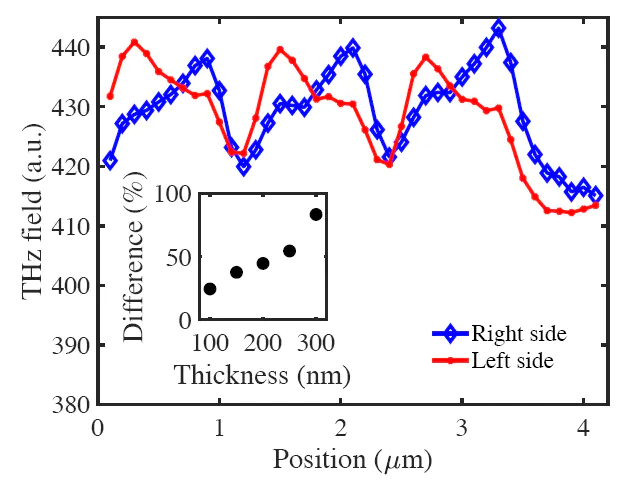
Fig. 10: Shadowing of the scattered signal by the AFM tip
Overall, continuous-wave s-SNOM is suitable for studying the static properties of samples, such as surface topography and refractive index distribution; its system is simple and its imaging speed is fast. Time-domain spectroscopy (TDS) s-SNOM is suitable for studying ultrafast dynamic processes of samples, such as electron motion and molecular vibration; its system is complex, but it can provide extremely high time resolution. In experiments, the correct working mode should be selected according to the experimental results we need.
References:
[1].Yue Dongdong, You Guanjun. Research on scattering-type terahertz scanning near-field optical microscopy[J]. Optical Instruments, 2020, 42(2): 64-69.
[2].Zhang Zhuocheng, Wang Yueying, Zhang Xiaoqiuyan, et al. Investigation of tip-sample interaction and its influence in terahertz scattering-type scanning near-field optical microscopy[J]. Acta Physica Sinica, 2021, 70(24): 248703-248707.
[3].Mester L, Govyadinov A A, Hillenbrand R. High-fidelity nano-FTIR spectroscopy by on-pixel normalization of signal harmonics[J]. Nanophotonics, 2022, 11(2): 377-390.
[4].Ma P, Kölbel J, Ying J F, et al. Terahertz near-field imaging of buried structures[J]. Optics Express, 2024, 32(22): 39785.
[5].Engelhardt A P, Hauer B, Taubner T. Visibility of weak contrasts in subsurface scattering near-field microscopy[J]. Ultramicroscopy, 2013, 126: 40-43.