Author: Zhang Dongchang
With the development of near-field microscopy imaging technology, the frequency bands used for near-field imaging and spectroscopy are gradually moving toward the terahertz range, but detection optical paths once used for infrared near-field work are not necessarily suitable for the terahertz band. For continuous-wave near-field detection optical paths, commonly used techniques include self-homodyne, homodyne, pseudo-heterodyne, heterodyne, and synthetic holography detection. Except for self-homodyne detection, all other methods use interferometric optical paths to purify the near-field signal. Pseudo-heterodyne detection requires the reference mirror to vibrate at high speed to modulate the reference phase; however, to achieve a sufficient phase modulation depth (90°), the vibration amplitude is positively correlated with the wavelength, making it difficult to implement in the low-frequency terahertz band with longer wavelengths. Synthetic holography does not place high demands on the moving speed of the reference mirror, but requires relatively complex post-processing to obtain near-field images, and is currently often applied in higher-frequency terahertz near-field optical paths of 2–10 THz. Since terahertz signals of a few hundred GHz have longer wavelengths and frequency conversion can be achieved using frequency multipliers and mixers, homodyne detection and heterodyne detection techniques are commonly used.
Homodyne detection technique
The homodyne detection technique was first successfully integrated into scattering-type scanning near-field optical microscopy (s-SNOM) by Taubner et al. using a Michelson interferometer structure. Exploiting the enhancement effect of the interferometric structure, this technique significantly improves the signal-to-noise ratio of near-field signals, thereby obtaining high-quality near-field spectral data. This technological advance not only enhances the signal quality of s-SNOM, but also lays a foundation for high-precision near-field optical imaging and spectral analysis.
The optical path schematic of this technique is shown in Fig. 1. The incident laser 1 passes through a beam splitter (BS) and is divided into two beams: reference 2 and pump light 5. The reference mirror in the reference path can be set at either the front position (F) or the back position (B); the distance between positions F and B is λ/8, corresponding to a phase difference of π/2. The focused pump light 5 is focused into the tip-sample near-field system region, and the near-field scattered signals 7 and 8 are reflected and adjusted by the beam splitter to interfere with the reference beam, forming a modulated beam 4, which is received by the detector and demodulated by a lock-in amplifier.
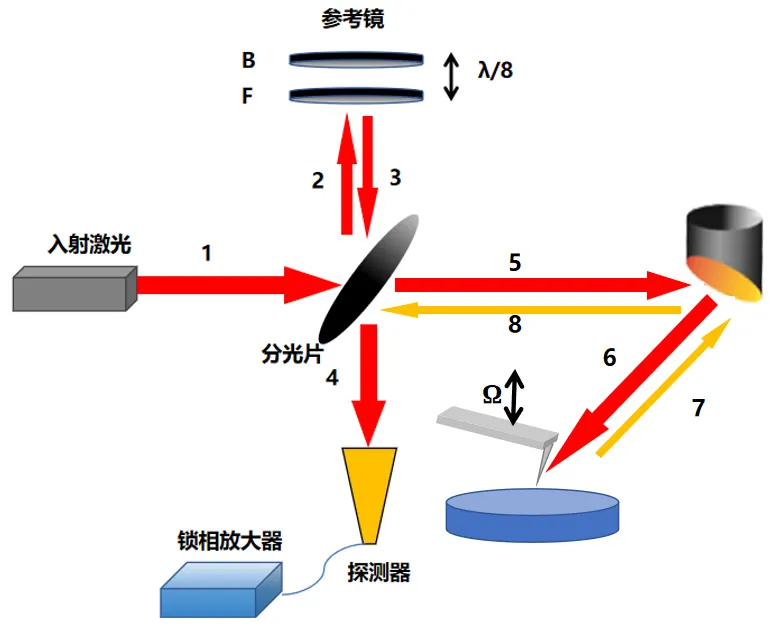
In experimental operation, the mirror in the reference path is first positioned at point F, a forward scan of the sample is performed, and the corresponding signal intensity is recorded. The mirror in the reference path is then positioned at point B, a backward scan is performed, and the signal intensity is recorded again. By comparing the signal responses at the two different scan positions, the in-phase and quadrature (out-of-phase) signals of the sample can be extracted separately. Using these signal data, the amplitude and phase information of the sample's near-field region can be further calculated, providing key parameters for subsequent optical property analysis.
The homodyne detection technique achieves precise detection of the sample's near-field signal by precisely controlling the mirror position in the reference path and recording the near-field signals at two orthogonal positions. This technique can comprehensively record the amplitude and phase information of the signal. In this scheme, the detector output signal contains three main electric field components: the near-field scattered field Eₛ, the background scattered field E b, and the reference field Eᵣ. According to relevant optical theory, the signal expression can be written as follows:
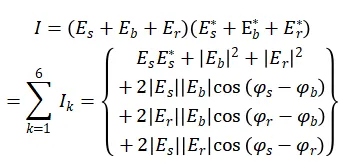
Since the optical scattering effect is relatively weak, the reference field is much stronger than the scattered field and the background scattered field, i.e.,

, so the signal intensity is mainly determined by I₃, I₅, and I₆ in the above equation. Among these three terms, only I₆ contains the near-field scattered field Eₛ, so how to extract the near-field signal from this term is the key to this technique. For I₆:

By recording the sample's forward-scan signal (I₆-forward) and backward-scan signal (I₆-backward), and analyzing and calculating the signal at the second harmonic with a lock-in amplifier, two mutually orthogonal expressions can be obtained:

Assuming the reference beam in the system is stable, the amplitude and phase information of the second-order signal, namely F₂ and φ₂, can be easily obtained from the following expressions:
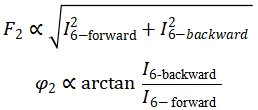
Based on the above analysis, this technique can effectively filter out the background noise mixed into the signal and amplify the useful signal. In actual implementation, the detector can be a fast millimeter-wave detector, and processing the images obtained at the two reference mirror positions yields pure near-field intensity and phase imaging.
Heterodyne detection technique
Heterodyne detection, as a frequency conversion method, was first introduced into s-SNOM systems in 2000. This technique can effectively eliminate background noise and accurately measure the optical properties of samples. Fig. 2 shows a typical application schematic of this technique. The incident light passes through a beam splitter and is divided into pump light 1 and reference light 5. After reflection, the pump light is focused onto the probe vibrating at frequency Ω and interacts with the sample. The scattered light 4, carrying fine structural information of the sample, is thus received by the far-field parabolic mirror. Meanwhile, after frequency modulation, the frequency of the reference light becomes ω+G; the frequency-shifted reference beam 7 then merges with the scattered light 4 to form a modulated beam 8. To thoroughly eliminate background noise, a lock-in amplifier is used to demodulate at the frequency point G+nΩ, where n represents a multiple of the frequency Ω.
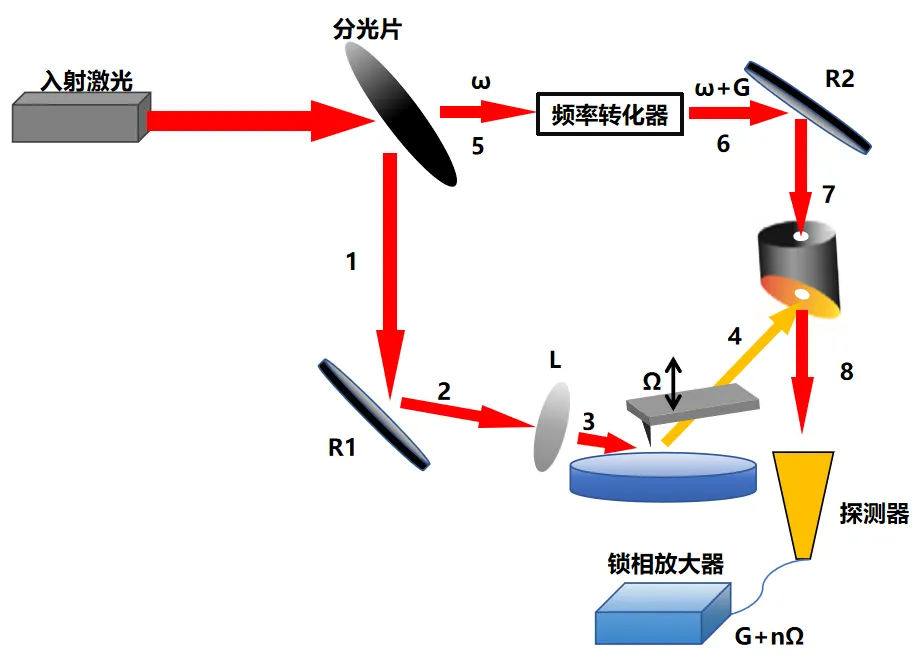
Fig. 2 shows the optical path implementation of the heterodyne detection technique. Unlike homodyne detection — which records two orthogonal signals by adjusting the phase of the reflected light in the reference path and thereby derives the near-field signal — heterodyne detection changes the frequency of the reference light through a frequency modulator and demodulates the signal through the difference-frequency effect. In this scheme, the frequency of the reference beam is converted to ω+G by an acousto-optic modulator, so its complex amplitude can be expressed as:

The signal detected by the detector can be expressed as:
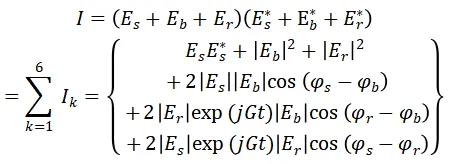
Since , the three terms I₃, I₅, and I₆ dominate the signal. Among them, I₃ is the signal contributed by the reference light and is therefore a constant. I₅ and I₆ can be expanded into the following forms:
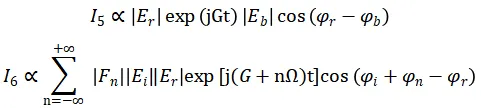
From the above formulas, we can see that I₅ contains only a single frequency component G, while I₆ consists of a series of frequency components — specifically, it is a sum of infinite series terms with frequencies G+nΩ. By demodulating at the G+nΩ component with a lock-in amplifier, all terms in the above equation except I₆ are eliminated. It is worth noting that I₆ depends only on Eᵣ and Eₛ, which means that this technique can theoretically achieve complete separation of the final signal from background noise. Further analysis shows that if demodulation is performed at the frequency G+2Ω, the resulting intensity signal can be expressed as:

From the above equation, under determined conditions Eᵢ, Eᵣ, φᵢ, and φᵣ are all constant values, and the sample's amplitude and phase information, namely F₂ and φ₂, depends only on the intrinsic properties of the sample. Therefore, the sample's amplitude and phase information can be deduced from the signal acquired by the lock-in amplifier, and samples can then be identified and distinguished by comparing signals between different samples. In the band of a few hundred GHz, in actual implementation, a second terahertz source with a certain frequency difference (G) from the incident signal can be used as the reference signal, entering the mixer together with the background and scattered signals. After obtaining the intermediate-frequency signal, one can choose to demodulate at the frequency G+nΩ, or mix again with a signal of frequency G and then demodulate at the nΩ frequency, yielding pure near-field intensity and phase information.
References
[1] Dai G, Yang Z, Geng G, et al. Signal detection techniques for scattering-type scanning near-field optical microscopy[J]. Applied Spectroscopy Reviews, 2018, 53(10): 806-835.
[2] Liewald C, Mastel S, Hesler J, et al. All-electronic terahertz nanoscopy[J]. Optica, 2018, 5(2): 159-163.
[3] Dai G, Wang J, Zhang X, et al. Low terahertz-band scanning near-field microscope with 155-nm resolution[J]. Ultramicroscopy, 2021, 226: 113295.
[4] Keilmann F, Hillenbrand R. Near-field microscopy by elastic light scattering from a tip[J]. Philosophical Transactions of the Royal Society of London. Series A: Mathematical, Physical and Engineering Sciences, 2004, 362(1817): 787-805.
[5] Schnell M, Carney P S, Hillenbrand R. Synthetic optical holography for rapid nanoimaging[J]. Nature communications, 2014, 5(1): 3499.
Submission|Zhang Dongchang
Layout|Xiang Shaolian