In the world of chips—the hidden cornerstone of modern technology—a sweeping “microscopic miniaturization” has been unfolding for more than half a century. In today’s advanced commercial chips, the critical physical dimensions of the transistors inside have entered the scale of tens of nanometers, or even a few nanometers. In such a tiny world, even minute fluctuations of just a few dozen atoms can determine the computing performance and power consumption of an entire chip.
However, the soul that determines a chip’s vitality is not only those static silicon transistor structures, but the free charge carriers—electrons and holes—that move through them and carry signals. How many carriers are injected into different regions, where they gather, and how mobile they are constitute the fundamental logic by which chip designers instill “intelligence” into transistors.
This presents scientists in micro- and nano-scale inspection with a world-class physics challenge: how can we produce a high-definition “distribution map” of charges at the nanoscale without damaging precision chips, and even accurately count carrier concentrations in micro-regions?
The Dilemma of Chip “Health Checks”: Why Do Conventional Methods Keep Hitting a Wall?
For nanoscale semiconductor structures, conventional inspection equipment often finds itself in a dilemma:
● “Seeing the structure clearly, but not the charge”: Conventional transmission electron microscopy (TEM) can clearly resolve atomic-scale lattice arrangements, but because high-energy electron beams have difficulty sensing the weak electrical states of free carriers, it is often powerless when faced with charge distributions diffused throughout the lattice.
● “A heavy hand can easily damage the sample”: Scanning Spreading Resistance Microscopy (SSRM) presses an extremely hard conductive diamond probe firmly into the chip surface to measure conductivity; after measurement, the micro- and nanostructures often suffer irreversible mechanical scratches and damage.
“Only the total amount, not the microscopic location”: Although secondary ion mass spectrometry (SIMS) can accurately determine exactly how many impurity atoms have been implanted into a material, it can only perform large-area sputtering and is completely unable to resolve lateral distribution details within a width of a few tens of nanometers.
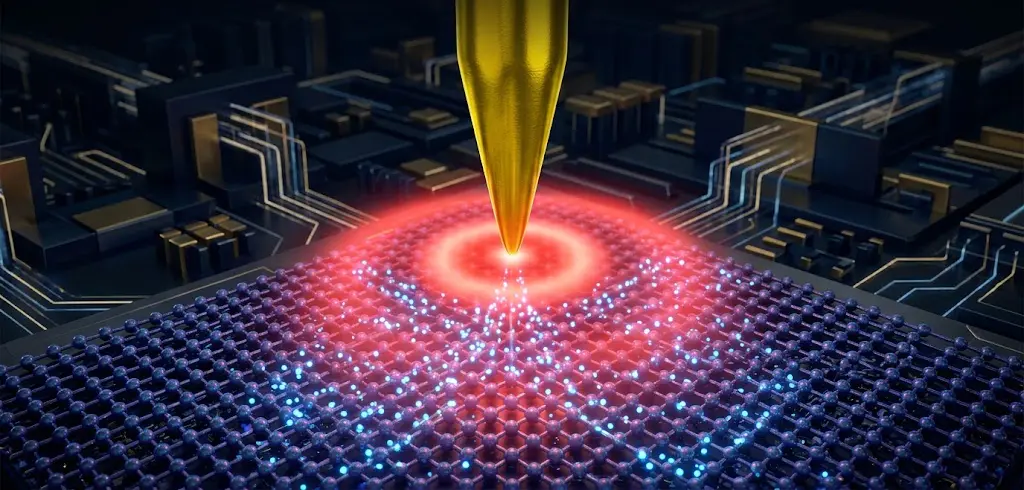
To break this deadlock, scientists turned their attention to two powerful tools of the microscopic world—high-frequency microwaves and terahertz light—and, with the help of the atomic force microscope (AFM) nanoprobe, whose tip is tens of thousands of times finer than a human hair, embarked on a “charge wind-catching journey.”
From Microscale Capacitance to Microwave Radar — The Breakthrough of Scanning Microwave Microscopy (SMM)
To detect charge at the nanoscale, the most natural approach is to apply an electrical signal to the probe.
Early Scanning Capacitance Microscopy (SCM) was like a doctor with a stethoscope: a metal probe touched the semiconductor surface, and a high-frequency small AC voltage caused charges inside the semiconductor to periodically accumulate and disperse under the electric field. By sensing the rate of change of local capacitance, engineers could roughly distinguish n-type and p-type regions through bright-dark contrast, much like viewing a black-and-white film. However, its pain points were that the signal tended to drift, and it was difficult to provide a directly quantified concentration value.
1. An SMM Microscope That Brings Gigahertz “Radar”
To achieve fully quantitative measurements, researchers at the Technical University of Munich and other institutions have advanced Scanning Microwave Microscopy (SMM).
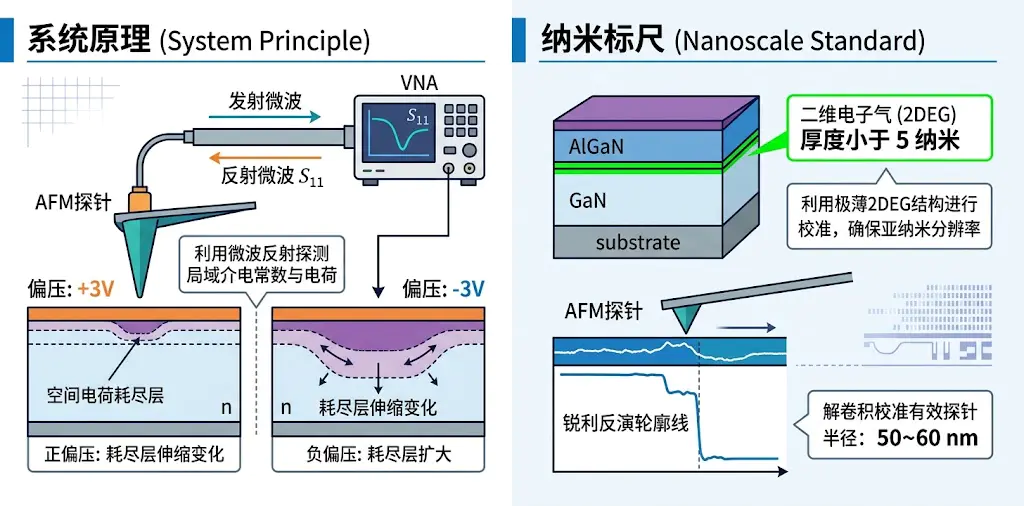
Its core concept is remarkably ingenious: an ultra-fine conductive nano-probe is connected directly to a gigahertz (GHz) vector network analyzer (VNA). The probe serves not merely as a topography-scanning feeler, but also as a miniature high-frequency transmitting and receiving antenna. When microwaves are launched along the probe toward the chip surface, the carrier distribution in the microscopic region acts like reefs beneath the water surface, reflecting a distinctive microwave signal (reflection coefficient S₁₁) back into the detector.
2. Cleverly Using a "Two-Dimensional Electron Gas" as a Nanoscale Ruler
In the microwave world, just how large is a probe’s “electromagnetic feeler”? It is not exactly equal to the geometric thickness of the probe’s mechanical tip—it is also influenced by the penetration of the electromagnetic field inside the semiconductor.
The researchers adopted a highly creative calibration approach: they identified a special gallium nitride semiconductor heterostructure (AlGaN/GaN) whose cross-section spontaneously forms a "two-dimensional electron gas (2DEG)" with a theoretical width of less than 5 nm. This extremely thin electron layer acts like nature's most perfect ultra-fine nanoscale ruler. As the probe scans over it, recording the reflection profile, and then through a mathematical "deconvolution" algorithm, the "true effective interaction radius" of the microwave probe in its working state (typically about 50 to 60 nm) is successfully determined, eliminating the geometric errors in quantitative calculations from the source.
3. A Mathematical Decoding Method for Determining Charge Polarity and Calculating Concentration
Knowing the probe size, how can the charge concentration be derived from the microwave signal?
● Polarity identification (ΔC differential method): Apply +3 V and -3 V DC bias voltages to the probe, driving the sample surface charge into "accumulation" or "depletion" states, respectively. Using the sign of the differential capacitance ΔC = C(+3 V) - C(-3 V), you can determine at a glance whether the measured micro-region is electron-dominated (n-type) or hole-dominated (p-type).
● Inverting absolute concentration: The width of the surface charge depletion layer in a semiconductor has a rigorous analytical correspondence with the internal free carrier concentration. By establishing an electrostatic coupling physical model, scientists use the Lambert W function—a purely mathematical tool—to directly retrieve the absolute carrier concentration within milliseconds. After correcting the native oxide thickness using a known reference region on the sample, this method keeps the concentration measurement deviation within ±30% over a doping range spanning several orders of magnitude.
In cross-sectional failure analysis of industrial-grade electrostatic discharge (ESD) protection diodes, SMM has delivered outstanding results: it not only reconstructed the complex multi-junction structure with high fidelity, but also, when the chip exhibited micron-scale abnormal leakage, precisely captured a nanoscale charge accumulation channel at the insulating layer interface, directly exposing the defective charges responsible for chip breakdown!
Harnessing the “Nano Light Needle”—The Cross-Domain Disruptive Power of Terahertz Near-Field Optics (THz s-SNOM)
Microwave techniques are powerful, but when facing faster, finer nanoscale devices, scientists yearn for a non-destructive probing technology that requires no mechanical squeezing and is driven entirely by coherent optical fields.
At this point, terahertz waves (THz, with wavelengths typically on the order of hundreds of micrometers) took center stage.
1. Why is infrared light invisible, yet terahertz can hit the mark in one shot?
The visible or mid-infrared light we are familiar with has such a high frequency and relatively large photon energy that when it strikes a semiconductor surface, the comparatively “sluggish” free electrons inside cannot keep up with the frantic oscillations of the light field. They remain essentially stationary, making the semiconductor appear as unremarkable as ordinary insulating glass.
But the frequency of terahertz waves falls exactly in the trillions-of-cycles-per-second (10¹² Hz) band, and their photon energy is extremely low—only a few millielectronvolts. This is precisely why they resonate strongly with the natural collective oscillation frequency of free carriers in conventional semiconductors, the plasma frequency (ωp)! Free charges are perfectly at home in the terahertz electric field, producing a keen absorption and scattering response to the light.
2. Breaking Through the Physical Ceiling:Confining hundred-micrometer light waves to tens of nanometers.
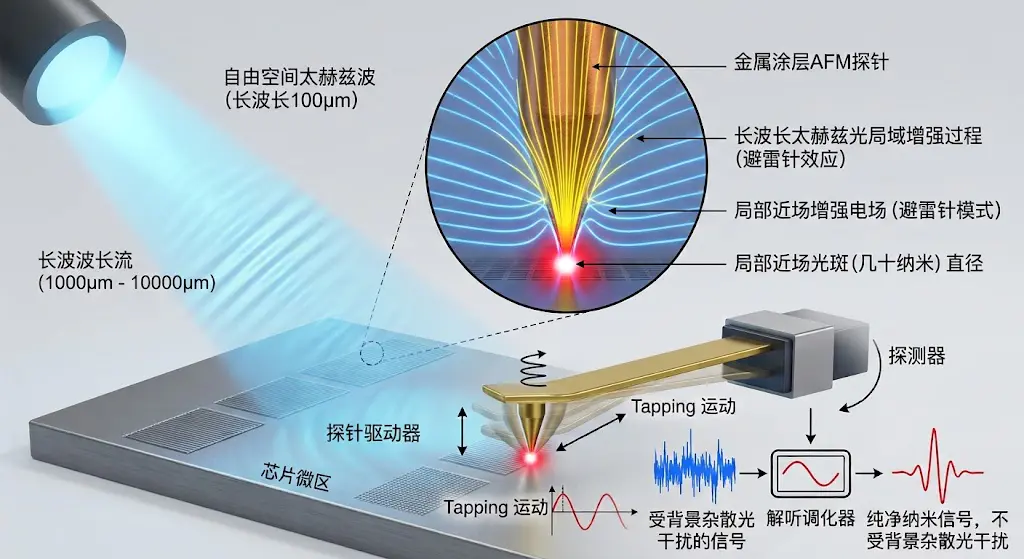
However, conventional optics is bound by an unbreakable iron law—the “diffraction limit”: no matter how tightly a beam of light is focused, the resulting focal spot diameter generally cannot be less than half its own wavelength (for terahertz waves, the spot is at least hundreds of micrometers across). Using a spot hundreds of micrometers wide to observe chip pins only tens of nanometers in size is like repairing watch gears with an excavator.
To break through this limit, scattering-type scanning near-field optical microscopy (s-SNOM) emerged.
Scientists install an extremely fine metal probe under the microscope. When a broad terahertz beam is focused onto the probe, the metal probe produces a remarkable “lightning rod effect”: free-space electromagnetic waves are concentrated into a region of just a few tens of nanometers at the very tip, forming an intense and extremely localized “nanoscale near-field optical needle.” The probe taps gently up and down on the sample surface (with a tapping amplitude of only a few tens of nanometers), so only the tiny sample region immediately adjacent to the tip apex is probed and generates scattering. By using a lock-in amplifier to extract high-order tapping harmonics, long-range background stray light is filtered out, and the spatial resolution is improved to an astonishing 40–50 nanometers (equivalent to one three-thousandth of the wavelength, surpassing the diffraction limit by more than a thousand times)!
3. All-solid-state integration:Say goodbye to expensive, bulky "research behemoths"
Early terahertz nanoscopes were extremely delicate, often requiring femtosecond ultrafast lasers or free-electron laser sources that stood several stories tall and were prohibitively expensive—sometimes even requiring liquid helium to cool the detector to below −200 °C.
In 2018, scientists led by Professor Fritz Keilmann published a landmark breakthrough in Optica: they developed an all-electronic, room-temperature terahertz nanoscope!
The research team abandoned bulky optical lasers and instead directly used a commercial microwave frequency synthesizer to output 9–14 GHz microwaves, which were then multiplied through a chain of semiconductor Schottky diodes for 54th-order high-order frequency multiplication (×54), directly generating pure 0.6 THz terahertz waves at room temperature. Combined with room-temperature Schottky mixing detection technology, the system successfully achieved an ultra-high resolution of 50 nanometers on an all-silicon static random-access memory (SRAM) chip, resolving extremely weak carrier concentration distributions as low as 10¹⁶ cm⁻³ and even clearly delineating a graded p-n junction transition region only 500 nanometers wide.
Time-Domain Spectroscopy and "Dance Step Rhythm"—How to Weigh Nanoscale Micro-Regions?
Focusing terahertz waves onto the tip is only the first step. Accurately converting the light scattered from the probe into charge concentration requires a rigorous bridge of theory and algorithms.
1. Time-domain hyperspectral:Obtain full-band information in a single scan
Past single-frequency laser measurements were like taking a photograph with a single-color flashlight; hyperspectral microscopy combined with terahertz time-domain spectroscopy (THz-TDS), by contrast, is like capturing an ultrafast “full-color ultrasound” of the chip.
Researchers use femtosecond pulses to generate broadband terahertz pulses covering 0.4 to 1.8 THz, and the probe-scattered signal is recorded point by point by a room-temperature detector. By enclosing the entire microscope system in a transparent sealed chamber filled with dry, high-purity nitrogen, the absorption of weak terahertz signals by water vapor in the air is completely eliminated. A single scan yields a three-dimensional “hyperspectral data cube” containing spatial positions and continuous terahertz spectra, allowing scientists to slice it arbitrarily and observe micro-region charge distribution images at any frequency.

2. The Secret of Phase:Light waves have not only intensity, but also a “beat.”
In optical detection, most people naturally focus on light intensity (amplitude), but nano near-field physicists often turn their attention to phase.
The phase records how many “beats” the wave crest of a terahertz light wave lags after the light encounters free carriers. As the terahertz frequency approaches the semiconductor’s plasma resonance frequency, violent electron oscillations accompanied by significant Ohmic energy dissipation cause the phase of the near-field scattered light to shift extremely sharply.
If only the amplitude is measured, two completely different carrier concentrations may sometimes happen to produce the same light intensity (a multi-solution degeneracy dilemma); however, when amplitude and phase are plotted together in the complex coordinate system, two independent physical constraints can lock in the global optimum, completely removing the ambiguity of the inversion results and dramatically boosting the confidence of nanoscale semiconductor charge quantification!
References
[1] Huber, A. J., Keilmann, F., Wittborn, J., Aizpurua, J., & Hillenbrand, R. (2008). Terahertz near-field nanoscopy of mobile carriers in single semiconductor nanodevices. Nano Letters, 8(11), 3766–3770.
[2] Liewald, C., Mastel, S., Hesler, J., Huber, A. J., Siegert, R., & Keilmann, F. (2018). All-electronic terahertz nanoscopy. Optica, 5(12), 1591–1596.
[3] Hommel, S. (2016). High resolution probing of charge carrier properties in semiconductor device materials [Doctoral dissertation, Technische Universität München]. mediaTUM - Medien- und Publikationsserver.
[4] Aghamiri, N. A., Hesseller, F., & Keilmann, F. (2019). Hyperspectral time-domain terahertz nano-imaging. Optics Express, 27(17), 24231–24242.
[5] Wehmeier, L., et al. (2026). Analytical modeling and finite-dipole implementation for nanoscale semiconductor carrier profiling. ACS Photonics.
[6] Caughey, D. M., & Thomas, R. E. (1967). Carrier mobilities in silicon empirically related to doping and field. Proceedings of the IEEE, 55(12), 2192–2193.
[7] Gibbons, J. F., Johnson, W. S., & Mylroie, S. W. (1975). Projected range statistics: Semiconductors and related materials (2nd ed.). Halsted Press.
Originally published in Chinese on the WeChat official account "见微而知著-觅几科技" (Miji Technology). English translation by Chengdu Miji Technology Co., Ltd. Source: WeChat article