Scattering-type scanning near-field optical microscopy (s-SNOM) enables super-resolution spectral imaging of the surfaces of a wide variety of materials and nanostructures. Although s-SNOM offers high lateral spatial resolution, relatively little research has been done on the near-field response characteristics perpendicular to the sample surface.
Current s-SNOM methods face challenges in probing vertical interactions, which indirectly stems from their large far-field scattering background — that is, reflections or scattering from the tip shaft and cantilever, as well as those caused by sample roughness, in the absence of short-range tip-sample interactions. In s-SNOM, to remove this large background, the probe tip is kept oscillating sinusoidally above the sample in tapping mode, and the near-field signal is extracted with a lock-in amplifier at multiples of the tip oscillation frequency. However, approach curves do not directly describe the vertical dependence of the near-field signal. They are obtained through a complex signal generation mechanism that depends on the tip oscillation amplitude and the order of lock-in demodulation. Therefore, approach curves lack a direct and unambiguous relationship with the vertical characteristics of the near-field interaction confinement between tip and sample.
The literature presented in this article proposes an accurate and fast reconstruction method to obtain the vertical characteristics of the near-field interaction. The authors also investigated the bound electromagnetic field components of surface phonon polaritons on boron nitride nanotubes, finding that they decay within a range of 20 nanometers, with significant phase variations in the near-field signal.

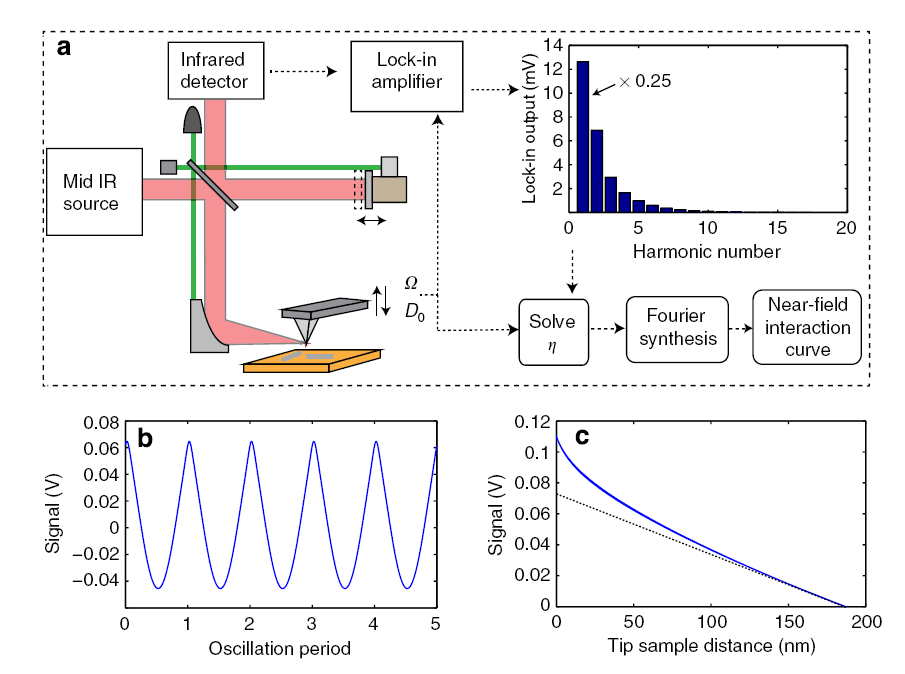
Fig. 1. a) Schematic of the experimental setup and working principle. The inset on the right shows the lock-in demodulated amplitude at the 18th harmonic measured experimentally with a platinum-coated probe and a gold substrate.
b) Reconstructed raw s-SNOM waveform.
c) Scattering-type scanning near-field optical microscopy interaction curve. The dashed line shows the linear trend of the background, which is characteristic of the far-field contribution.

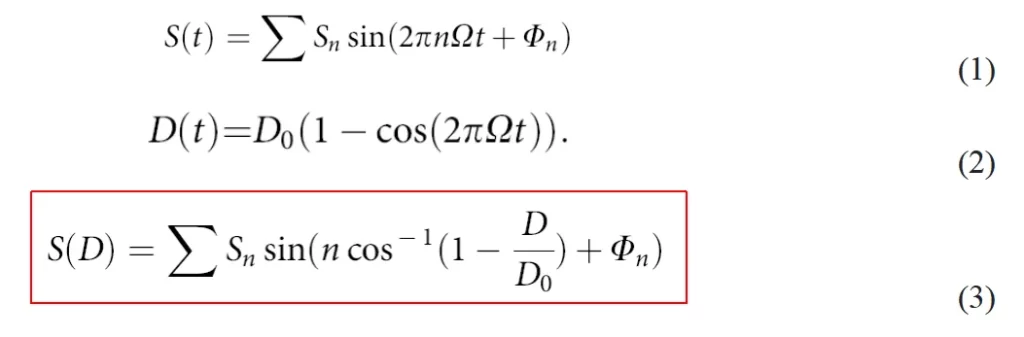
Figure 1a shows the experimental setup and working principle, with which the authors obtained the experimentally measured 18th-harmonic signal, and then reproduced its waveform via a Fourier series (Eq. 1), as shown in Figure 1b. Equation 2 describes the positional variation of the probe tip. Figure 1c shows the s-SNOM interaction curve obtained from Equation 3, where the dashed portion is the fitted far-field contribution. As can be seen from the figure, when the tip-sample distance is within 50 nanometers, a nonlinear growth of the signal is observed, i.e., the near-field signal dominates. At larger tip-sample distances, the far-field signal predominates.
For the AC far-field signal, the probe in sinusoidal mechanical oscillation scatters the incident infrared field over a nanoscale uniform region. Therefore, the AC component of the far-field contribution is sinusoidal and appears only in the first-harmonic demodulation. The following formula can thus be obtained:

If the value of η can be obtained in some way, the near-field signal can be fully determined. The authors argue that when the tip-sample distance D is large, the near-field signal is insensitive to changes in D, which can be used to solve for η — corresponding to minimizing the slope in the following formula:

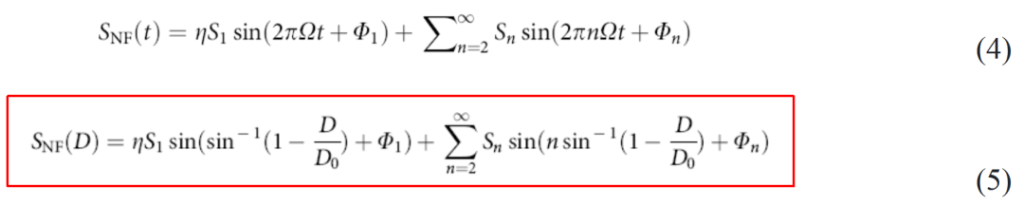
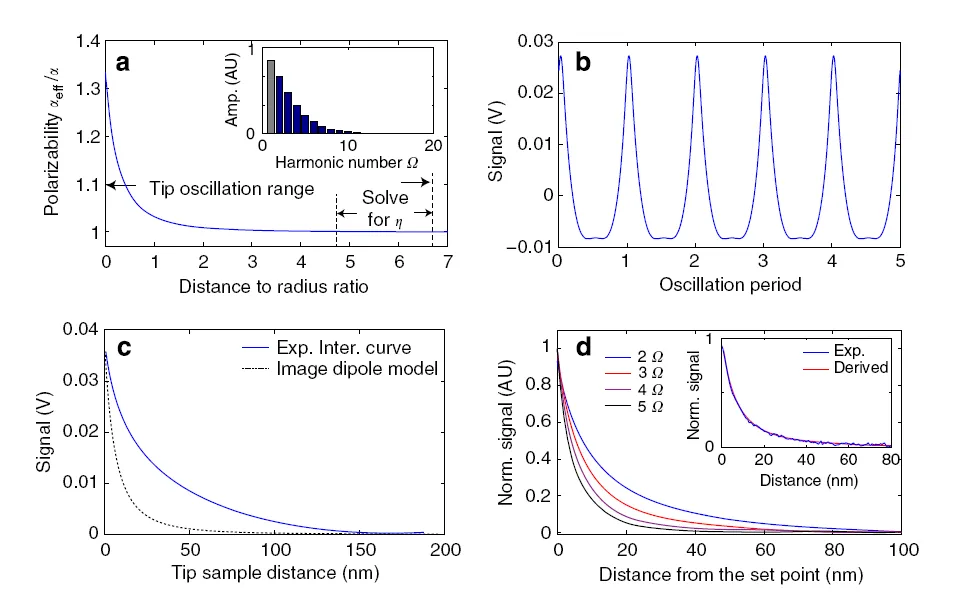
To verify the accuracy of the results, the authors compared the experimental results with the point dipole model (Figure 2a). Figure 2b shows the near-field time-domain signal obtained after solving for η. Figure 2c shows the s-SNOM interaction curve obtained from Equation 5, where the dashed line is the point dipole model interaction curve. Figure 2d shows the normalized approach curves at the second to fifth harmonics derived from the interaction curve; as can be seen, the third-harmonic normalization agrees almost perfectly with the experimentally obtained third-harmonic approach curve.

Fig. 2. a) Point dipole model simulation of the relationship between effective polarizability amplitude and tip-sample distance.
b) Near-field waveform reconstructed from the previous data. The first-harmonic contribution is found to be 0.262.
c) s-SNOM interaction curve. The dashed curve is the result plotted from the point dipole model. d) Normalized approach curves derived from the second to fifth harmonics of the interaction curve. The inset shows a comparison between the derived third-harmonic approach curve and the experimentally obtained third-harmonic approach curve.
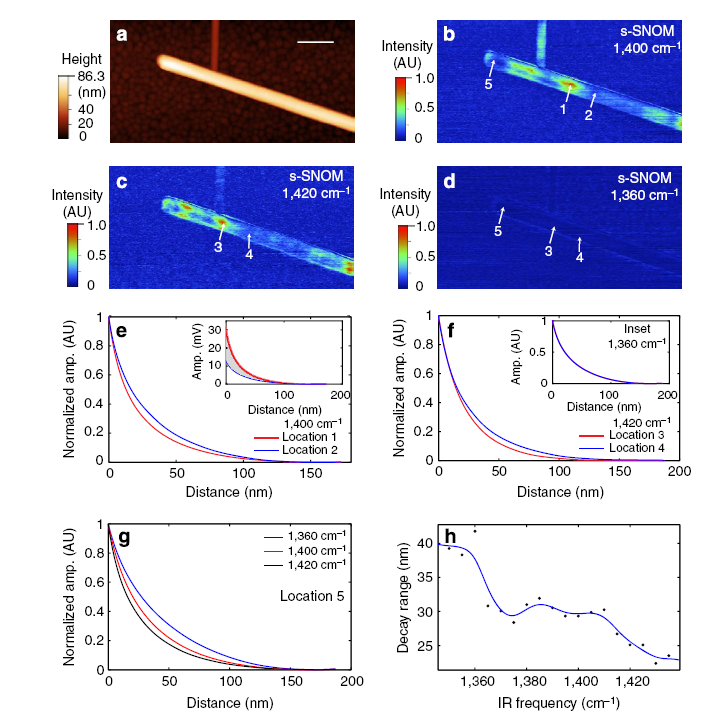
Finally, the authors applied the derived interaction formula to observe the vertical response of surface phonon polaritons on boron nitride nanotubes, as shown in Figure 3.

Fig. 3. a) AFM topography of a boron nitride nanotube.
b) Scattering near-field optical microscopy image at 1400 cm⁻¹.
c) Scattering near-field optical microscopy image at 1420 cm⁻¹.
d) Scattering near-field optical microscopy image at 1360 cm⁻¹.
e) Interaction curves at position 1 (red) and position 2 (blue) at 1400 cm⁻¹.
f) Interaction curves at position 3 (red) and position 4 (blue) at 1420 cm⁻¹. The interaction curves of positions 3 and 4 at 1360 cm⁻¹ are shown in the inset.
g) Interaction curves at position 5 at infrared frequencies of 1360, 1400, and 1420 cm⁻¹.
h) 1/e decay length values of the interaction curves at position 5 at infrared frequencies from 1350 to 1435 cm⁻¹ (black dots). The blue curve serves as a reference.
Measurements of the interaction curves indicate that the near-field signal from polaritonic materials comes from two sources. The first source is intrinsic near-field scattering, based on the modulation of the tip polarizability by the redistribution of charges, carriers, or dipoles in the sample. For boron nitride (BN), this contribution dominates at 1360 cm⁻¹, where surface phonon polaritons do not exist. Between 1350 cm⁻¹ and 1360 cm⁻¹, the decay length at 1/e of the amplitude is about 40 nanometers. The second contribution comes from the localized bound electromagnetic field components of the polaritons. The sharp metal tip converts the field components of the surface phonon polaritons into a detectable scattered light field. The bound field of the surface phonon polaritons lies close to the polariton-supporting surface of boron nitride, so when the tip is very close, it causes additional enhancement of the near-field scattering. Due to the presence of this short-range surface-bound component, the measured decay length of boron nitride at frequencies where surface phonon polaritons are active is shortened compared with the case without polaritons. The trend of decreasing decay length with frequency (Fig. 3f) indicates that at higher infrared frequencies, the field components of the surface phonon polaritons are more strongly bound to the boron nitride surface.
In summary, the literature presented in this article develops an experimental method for reconstructing vertical near-field interactions in scattering-type scanning near-field optical microscopy (s-SNOM), which is expected to be used for characterizing the vertical field distributions of a wide variety of nano-optical materials and structures.
References
Wang, L., Xu, X. Scattering-type scanning near-field optical microscopy with reconstruction of vertical interaction. Nat Commun 6, 8973 (2015). https://doi.org/10.1038/ncomms9973.